Further thoughts on Bike Score vs bike mode share

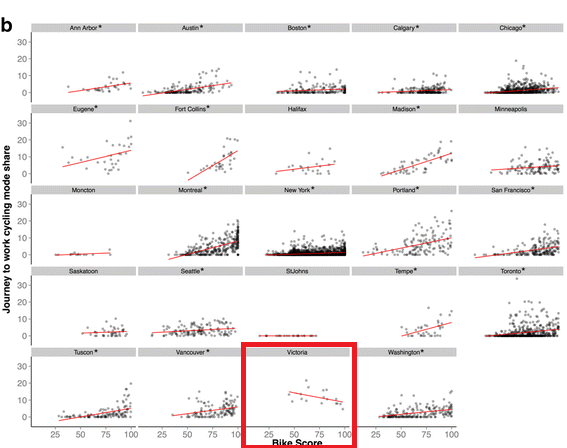
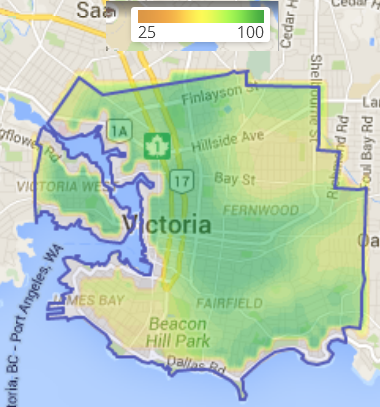
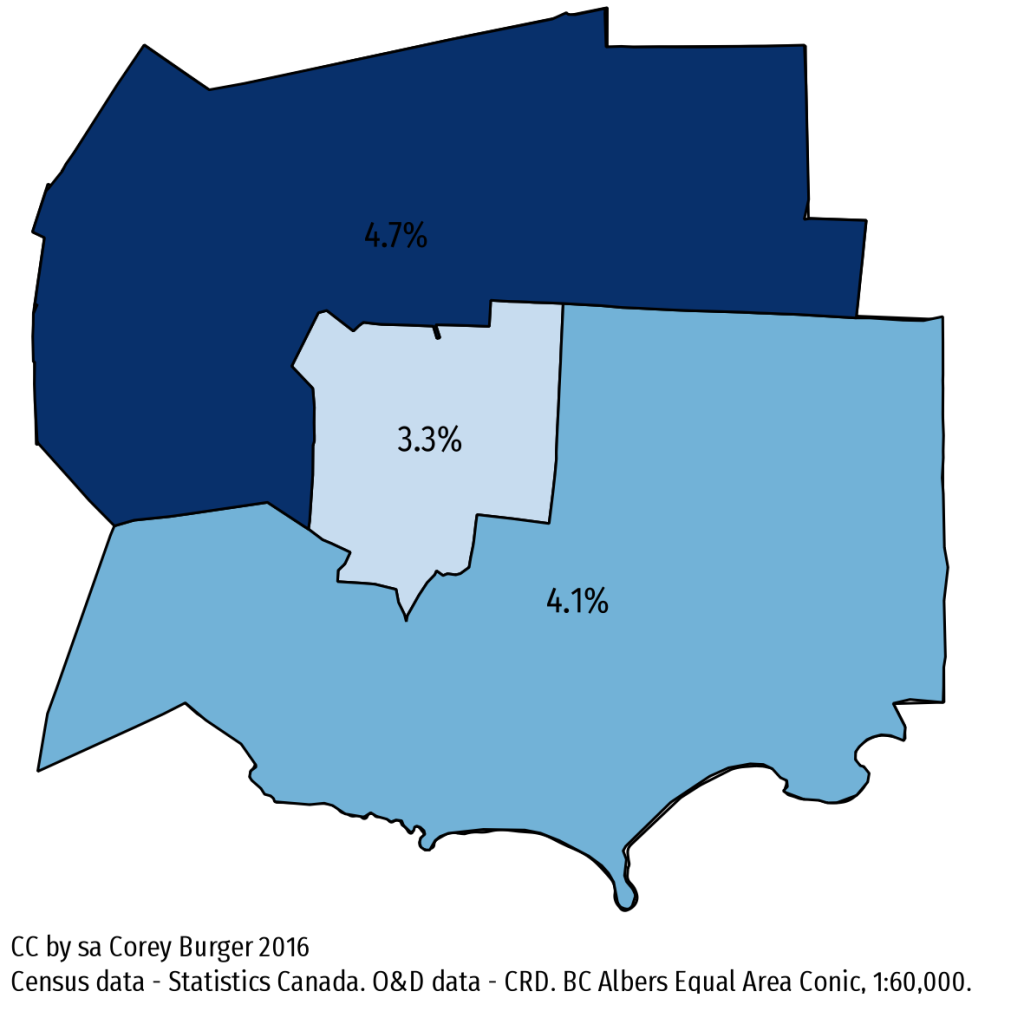
So yesterday I wondered why Victoria was so odd, given our bike mode share doesn’t match our Bike Score. Today I dig into another data point: the CRD’s Origin & Destination study (PDF) conducted in the fall of 2011. When looking at all travel reasons (work, school, etc.), it lines up a lot nicer with Bike Score data:

BikeModeShareCRDOD

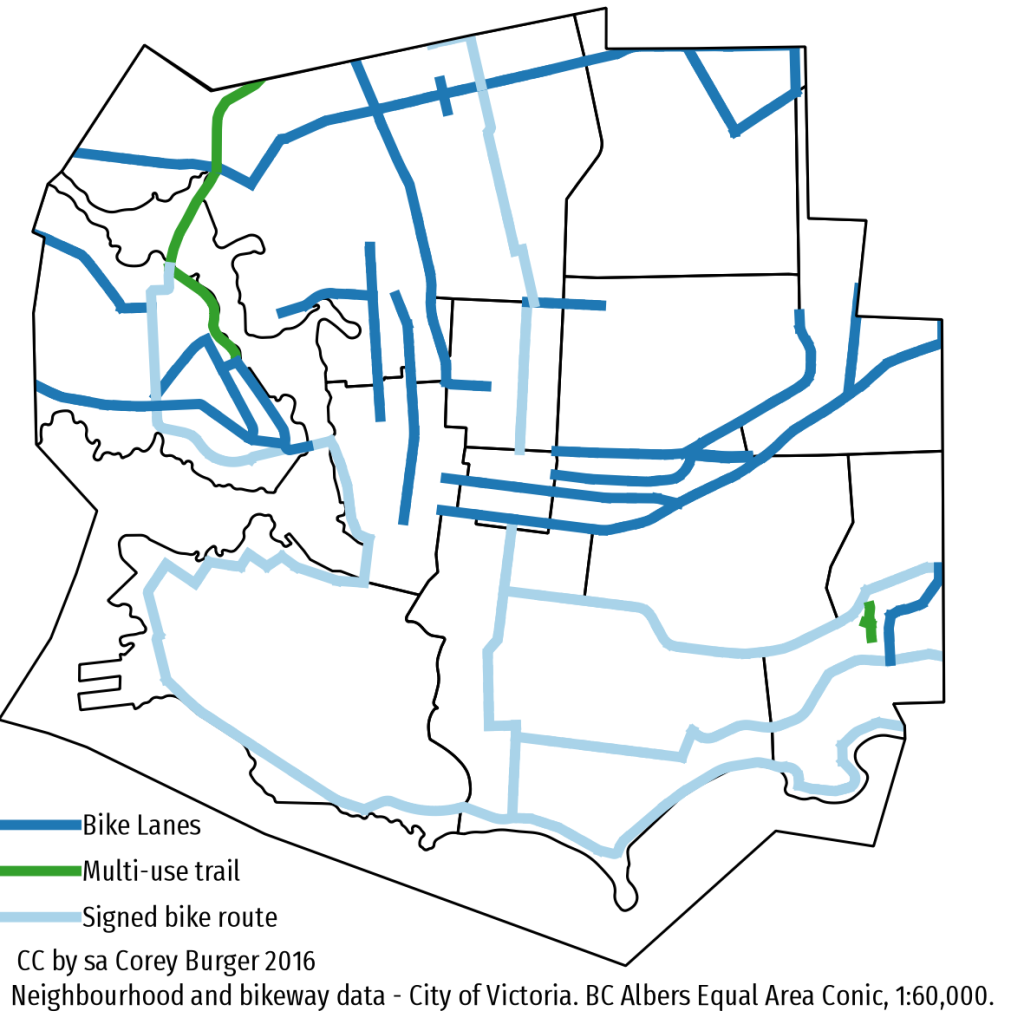
But what about the difference between this data and the NHS data we looked at yesterday? To compare them, you need the same geographies. Of course, the boundaries of these don’t quite line up (that would be too simple):

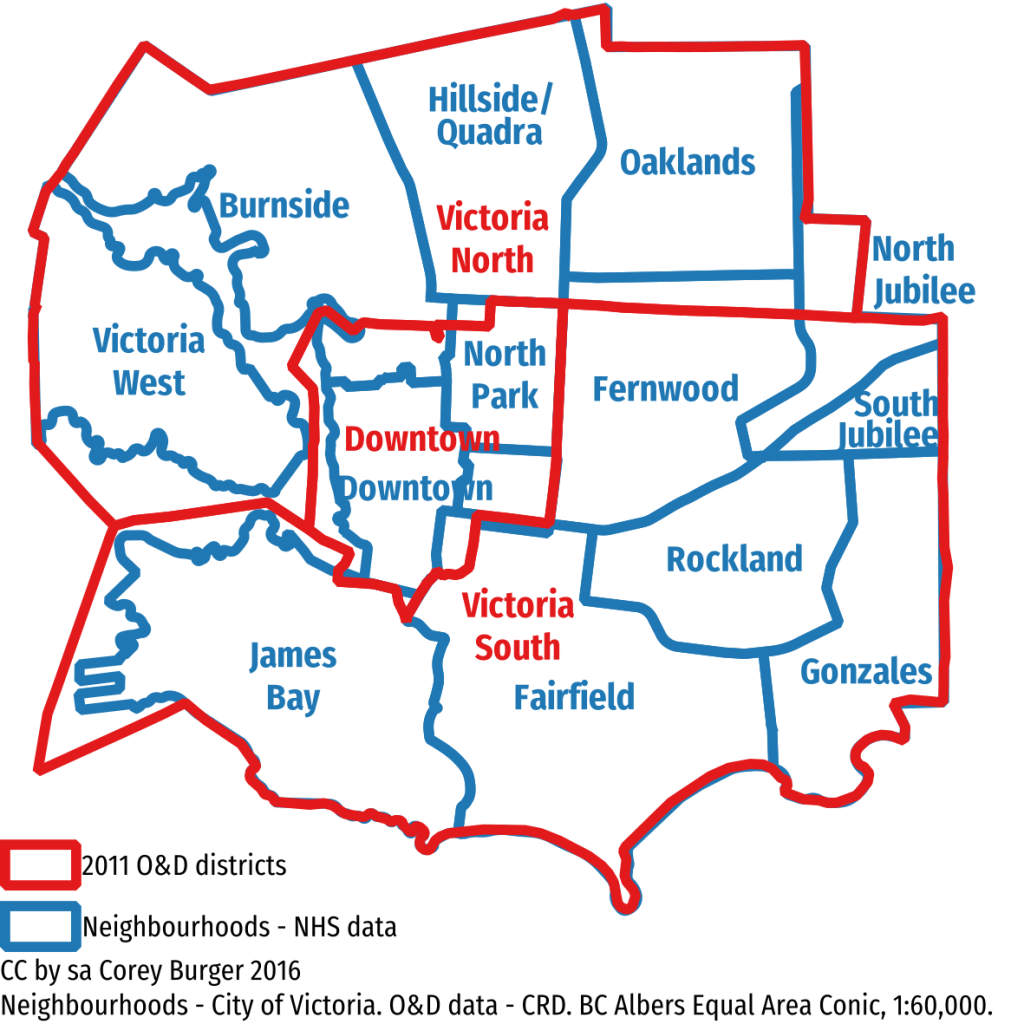
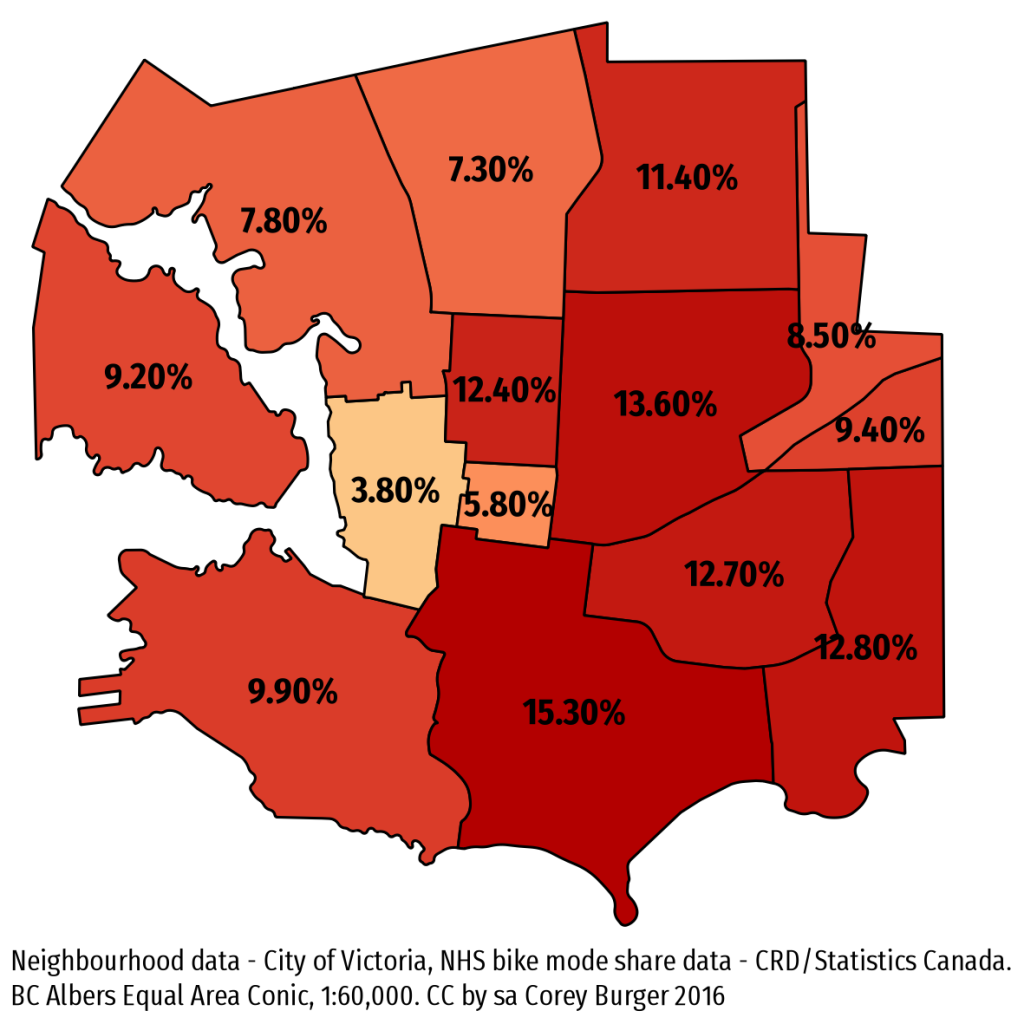
But when you compare the two using the O&D geography, comparing north to south shows the same pattern: north is higher in the CRD O&D while that is reversed in the NHS data.

NHS (work trips only) CRD Origin & Destination (all trips)
Victoria North 7.97% 4.7%
Downtown 8.11% 3.3%
Victoria South 12.07% 4.1%

What about comparing when the surveys were conducted? NHS asked about the week of May 1-7, 2011, while the Origin & Destination ran in the fall of 2011. But the weather impact should have hit both surveys equally, so that can’t explain it.

Margin of error might explain it. The CRD O&D at this level has a margin of error with between 2.8% and 9.5% (so larger than any differences). NHS doesn’t report margin of error, but it had a non-response rate of around 25%. Which is to say: take all these numbers with a grain of salt. So maybe all of this can be chalked up to bad numbers.

Bike mode share vs Bike Score: Why is Victoria so weird?

SFU’s Meghan Winters recently completed a paper looking at Bike Score and bike mode share (SFU news article) across several US and Canadian cities. The findings were as you would expect: higher Bike Score means higher bike mode share (to work). Except Victoria:

12966_2016_339_Fig2_HTML-partb

It looks like our bike score is actually negatively correlated with Bike Score. But why? Let’s look at where people bike in Victoria:

We have really high bike share in the south and east, but those areas show up very low in Bike Score. Conversely, there is low bike mode share in the north, especially Burnside/Gorge. Downtown and Harris Green also have low bike share largely because most people walk to work. But all these low mode share neighbourhoods have high Bike Scores:

BikeScore2016
Data from Walk Score – screenshot as data isn’t released publicly (sigh)

I have long suspected that Bike Score relatively simplistic breakdown of “bikeability” is a bit too simple. This isn’t really the fault of the Bike Score people, it really is a data problem. Good data about whether a street is “bikeable” simply isn’t available. What is available is infrastructure and topography.

In our case, most of the bike infrastructure that Bike Score tracks goes east or north/west – bike lanes on Douglas/Blanshard/Government or Fort/Yates/Pandora/Johnson and the two regional trails which run north/west.

Still, Bike Score is a valuable first-cut of a tool to help figure out what is happening. That Victoria doesn’t fit the pattern isn’t surprising, we are the anomaly when it comes to mode share – being several percentage points ahead of the next highest city in Canada. To better capture where people bike, I would love to see Bike Score innovate and do something similar to the CRD comfort index and use that instead of pure infrastructure, but given the massive data challenges, I am not holding my breath.